Water Vapour in Campaign Area#
We can use the HERA5 dataset (ERA5 on HEALPix) to get a quick overview over the water vapour structure in the field campaign area.
We’ll need a few libraries and the TCO data catalog:
import matplotlib.pylab as plt
import cartopy.crs as ccrs
import intake
from easygems.healpix import attach_coords, healpix_show, healpix_contour

cat = intake.open_catalog("https://tcodata.mpimet.mpg.de/internal.yaml")
In order to look at the short term structure, let’s select the hourly (PT1H) dataset:
era5 = cat.HERA5(time="PT1H").to_dask().pipe(attach_coords)
Note
There are also daily (P1D) and monthly (P1M) aggregations available.
With all the data at hand, let’s have a look at a map:
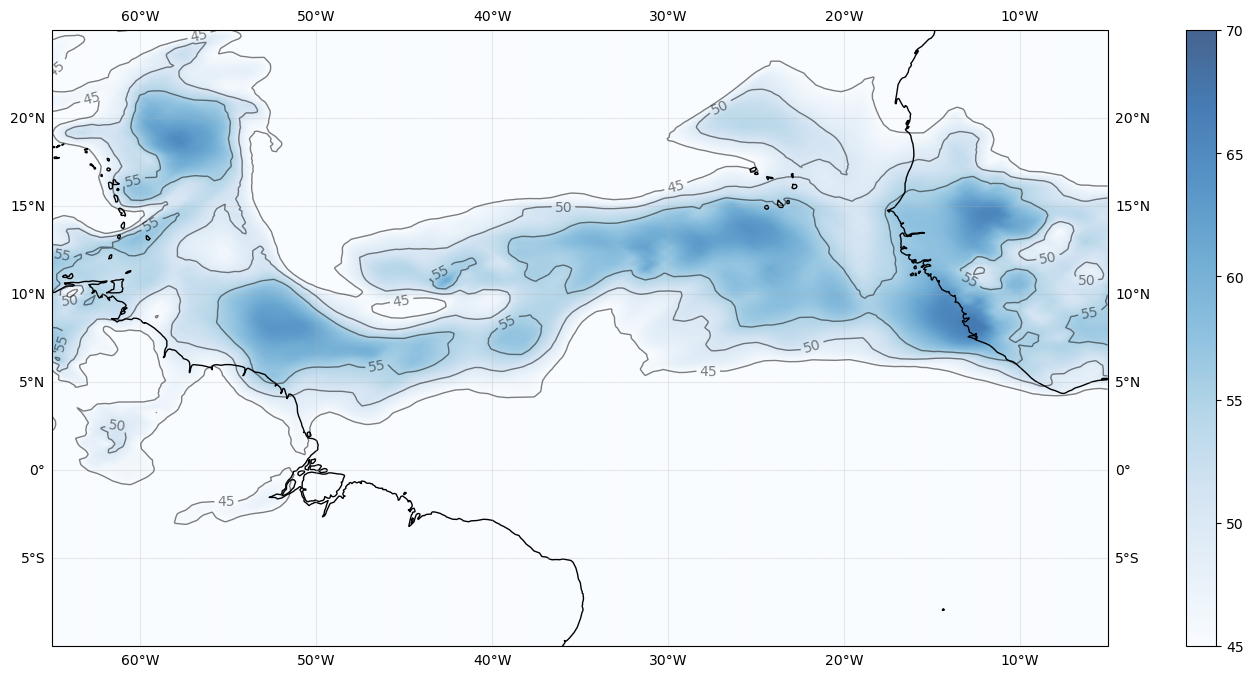
levels_cwv = [45, 50, 55]

plt.figure(figsize = (20, 8))
ax = plt.axes(projection=ccrs.PlateCarree())

ax.set_extent([-65, -5, -10, 25], crs=ccrs.PlateCarree())
ax.coastlines(alpha=1.0)
ax.gridlines(draw_labels=True, dms=True, x_inline=False, y_inline=False, alpha = 0.25)

im = healpix_show(era5.tcwv.sel(time="2020-08-15T12:00:00"), method="linear",
                  alpha = 0.75, cmap = 'Blues', vmin = 45, vmax = 70)
plt.colorbar(im)

contour_lines = healpix_contour(era5.tcwv.sel(time="2020-08-15T12:00:00"),
                                levels=levels_cwv, colors='k', linewidths=1, alpha = 0.5)

plt.clabel(contour_lines, inline=True, fontsize=10, colors='k', fmt='%d');