Temperature comparison#
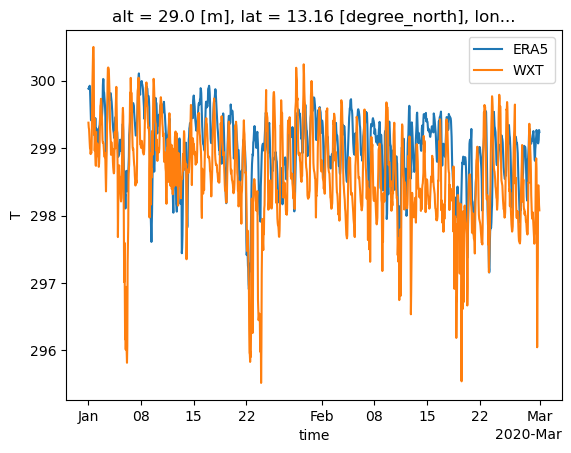
Let’s see how temperature readings at BCO compare with the ERA5 reanalysis:
import intake
import healpix as hp
import matplotlib.pylab as plt

cat = intake.open_catalog("https://tcodata.mpimet.mpg.de/internal.yaml")
wxt = cat.BCO.surfacemet_wxt_v1.to_dask()
era5 = cat.HERA5(time="PT1H").to_dask()

i_bco = hp.ang2pix(2**7, wxt.lon, wxt.lat, nest=True, lonlat=True)

era5["2t"].isel(cell=i_bco).sel(time=slice("2020-01", "2020-02")).plot(label="ERA5")
(wxt["T"].sel(time=slice("2020-01", "2020-02")).resample(time="1H").mean() + 272.15).plot(label="WXT")

plt.legend();
/home/runner/miniconda3/envs/orcestra_book/lib/python3.12/site-packages/xarray/groupers.py:487: FutureWarning: 'H' is deprecated and will be removed in a future version, please use 'h' instead.
  self.index_grouper = pd.Grouper(