
CTD measurements#
CTD (conductivity, temperature, and depth) measurements are an essential tool used in oceanography.
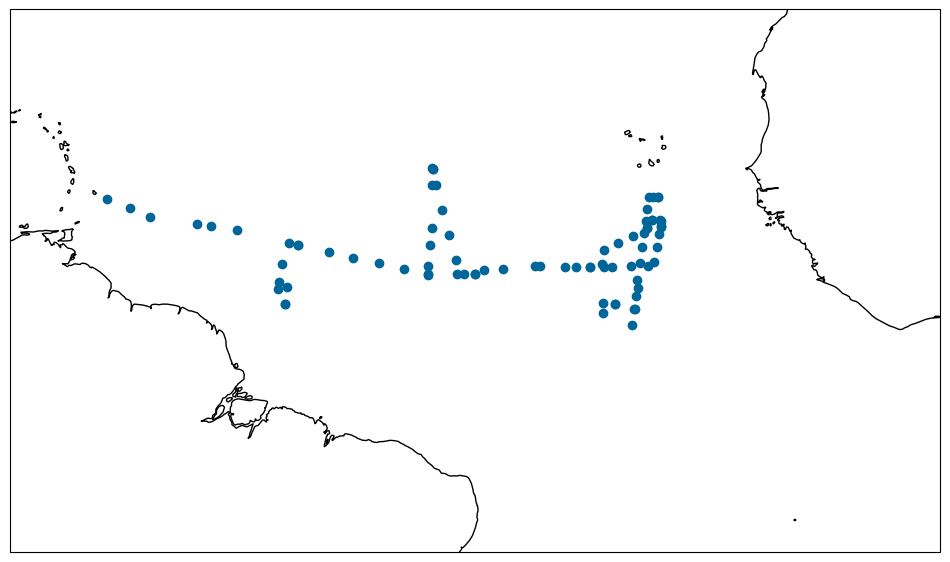
During BOWTIE, 82 CTD measurements were carried out at different locations in the tropical Atlantic:
import cartopy.crs as ccrs
import cmocean
import matplotlib.pyplot as plt
import xarray as xr


# root = "ipns://latest.orcestra-campaign.org"
root = "ipfs://Qmc1HU87eV2gKLaaiJsPuumpo6SQwLe9sPy3xVgEDywnFs"
ds = xr.open_dataset(f"{root}/products/METEOR/CTD.zarr", engine="zarr")

fig, ax = plt.subplots(figsize=(12, 8), subplot_kw={"projection": ccrs.PlateCarree()})
ax.set_extent([-65, -5, -10, 25], crs=ccrs.PlateCarree())
ax.coastlines()
ax.scatter(ds.LONGITUDE, ds.LATITUDE, color="#006699", transform=ccrs.Geodetic())
<matplotlib.collections.PathCollection at 0x7fdb58203ec0>
/home/runner/miniconda3/envs/orcestra_book/lib/python3.12/site-packages/cartopy/io/__init__.py:242: DownloadWarning: Downloading: https://naturalearth.s3.amazonaws.com/50m_physical/ne_50m_coastline.zip
  warnings.warn(f'Downloading: {url}', DownloadWarning)
These in-situ measurements allow scientists to compare vertical profiles of different physical and chemical properties throughout the campaign period:
fig, axes = plt.subplots(ncols=3, sharey=True, figsize=(12, 4.8))
ds.TEMP.plot(x="SOUNDING", cmap="cmo.thermal", ax=axes[0])
ds.DOX2.plot(x="SOUNDING", cmap="cmo.oxy", vmin=20, vmax=270, ax=axes[1])
ds.PSAL.plot(x="SOUNDING", cmap="cmo.haline", vmin=33, vmax=37, ax=axes[2])
axes[0].set_ylim(250, 0)
(250.0, 0.0)
