
IWV comparison#
ORCESTRA focuses on the area of the Inter-Tropical Convergence Zone (ITCZ), which we’ve commonly identified by areas of high integrated water vapour (IWV). We’ve used this quantity extensively during Flight Planning and several instruments measuring IWV have been deployed. This notebook compares a few instruments which measured IWV during the campaign.
We’ll first import some required libraries and set up the root path to the ORCESTRA data collection to a stable version.
If you are instead interested in the most recent updates, just use the ipns link instead.
import xarray as xr
import matplotlib.pylab as plt

# root = "ipns://latest.orcestra-campaign.org"
root = "ipfs://QmNUqnfu7dDYFn6MjRq5wC4EJNNtNDiX5XFShuREMiLuMF"
relative occurrence over entire campaign period#
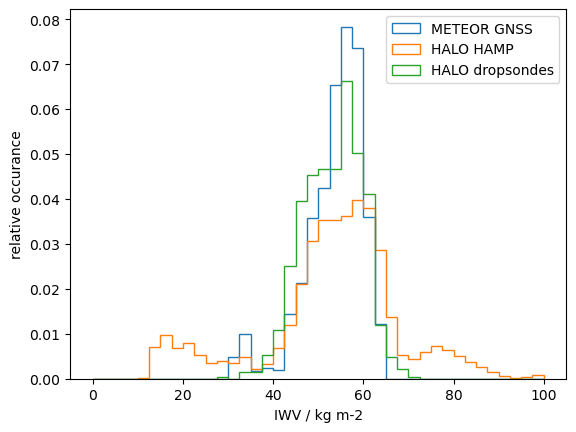
We’ll compare data from the GNSS sensors on RV Meteor as well as the microwave radiometer (HAMP) and the dropsondes from HALO. The three instruments all employ different sensing methods and sampled different areas of the observation region. Still, they overall sampled a similar regime and thus on average, we might expect similar results. This can be confirmed by the following histogram:
sources = [("METEOR GNSS", "METEOR/GNSS_IWV.zarr", "iwv"),
           ("HALO HAMP", "HALO/HAMP/full_iwv.zarr", "IWV"),
           ("HALO dropsondes", "HALO/dropsondes/Level_3/PERCUSION_Level_3.zarr", "iwv")]
for label, path, var in sources:
    ds = xr.open_dataset(f"{root}/products/{path}", engine="zarr")
    plt.hist(ds[var], bins=40, range=(0,100), density=True, histtype="step", label=label);
plt.xlabel("IWV / kg m-2")
plt.ylabel("relative occurance")
plt.legend();
Note
At least some of the data is still in early processing stages, so you still might find artifacts which should be removed in subsequent stages of quality control.
Although the instruments broadly agree, we can already see some features of the measurement principle. E.g.:
The microwave retrieval (HAMP) produces artificially high values when flying over land (instead of ocean). These values have not yet been removed and are visible in the histogram.
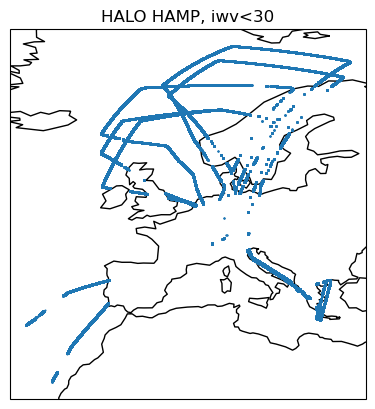
The lower IWV values of hamp (e.g. < 30 kg/m2) correspond to the 3rd phase of ORCESTRA, which was based in Europe (see next figure). This period was not covered by RV Meteor and used fewer dropsondes.
import cartopy.crs as ccrs
import cartopy.feature as cfeature

ds = xr.open_dataset(f"{root}/products/HALO/HAMP/full_iwv.zarr", engine="zarr")
low_iwv = ds.where(ds.IWV.compute() < 30, drop="True")

fig = plt.figure()
ax = fig.add_subplot(1, 1, 1, projection=ccrs.PlateCarree())
ax.add_feature(cfeature.COASTLINE)
plt.plot(low_iwv.lon, low_iwv.lat, ".", ms=1, transform=ccrs.PlateCarree())
plt.title("HALO HAMP, iwv<30");
data sources#
The datasets have been provided by various individuals and institutions. Please inspect the dataset attributes and contact the authors in case you use the data for scientific work.
METEOR GNSS
contact_person: Pierre Bosser (pierre.bosser@ensta-bretagne.fr)
creator_email: pierre.bosser@ensta-bretagne.fr
creator_name: Pierre Bosser
description: IWV estimates for R/V Sonne
featureType: trajectory
history: Created on 20241216_120643; 2025-01-30T13:14:56Z: converted to Zarr by Lukas Kluft (lukas.kluft@mpimet.mpg.de)
institution: ENSTA Bretagne
license: CC-BY-4.0
platform: RV METEOR
processing_software: GIPSYX v2.2 in PPP mode
project: ORCESTRA, BOW-TIE
references: "Bosser et al. 2021, ESSD"
resolution: IWV temporal resolution = 30 s
source: GNNS antenna
summary: ZTD are screened using range check and outlier check on both position and ZTD. ZTD are converted to IWV using ERA5 sea level pressure data, 1-hourly, 0.25x0.25 deg and VMF1 atmospheric integrated mean temperature, 6-hourly,  2.0x2.5 deg. See [Bosser et al., 2021, ESSD] for more information.
title: IWV data from GNSS antenna on R/V METEOR
version: v1.0
HALO HAMP
Host-PC_Software_Version: V9.45
Radiometer_Software_Version: V9.45
creator_email: jakob.deutloff@uni-hamburg.de, lukas.kluft@mpimet.mpg.de, clara.bayley@mpimet.mpg.de
creator_name: Jakob Deutloff, Lukas Kluft, Clara Bayley
featureType: trajectoryProfile
history: The processing software is available at https://github.com/orcestra-campaign/hamp_processing
keywords: Radiometer, Microwave, Integrated Water Vapor, Retrieval, HALO, ORCESTRA, PERCUSION, Tropical Atlantic
license: CC-BY-4.0
netCDF_Convention:  CF-1.0
platform: HALO
project: ORCESTRA, PERCUSION
references: 10.5194/amt-7-4539-2014
summary: This dataset contains retrievals of integrated water vapor (IWV) from the KV-band microwave radiometer onboard the HALO aircraft during the ORCESTRA campaign. The retrieval is based on a linear regression model and should not be used for quantitative analysis. The purpose of this data was to provide an estimate of IWV during the flights. The processing includes formatting the data, adding georeference information, filtering for altitudes above 4800 m and adding a land-sea mask.
title: Integrated Water Vapor Retrieval from the K-Band and W-Band Microwave Radiometers
version: 1.0

HALO dropsondes
creator_email: helene.gloeckner@mpimet.mpg.de, theresa.mieslinger@mpimet.mpg.de, nina.robbins@mpimet.mpg.de
creator_name: Helene Gloeckner, Theresa Mieslinger, Nina Robbins
featureType: trajectoryProfile
history: Level 1 ASPEN processing with Aspen V4.0.2
Level 2 quality control with pydropsonde 0.1.0.post6.dev0+9df510e
Level 3 processing with pydropsonde 0.1.0.post6.dev0+9df510e
Level 3 concatenation with pydropsonde 0.1.0.post6.dev0+9df510e

keywords: ORCESTRA, BEACH, Sounding, Dropsondes, Tropics, Atmospheric Profiles, Common Altitude
license: CC-BY-4.0
platform: HALO
project: ORCESTRA, PERCUSION, MAESTRO
references: https://github.com/atmdrops/pydropsonde
source: dropsondes
summary: This dataset is the Level 3 BEACH dataset. It contains quality controlled dropsonde data from the ORCESTRA field campaign with a common altitude dimension. All thermodynamic and dynamic variables are (re-)calculated consistently within the dataset and integrated quantities such as integrated water vapour are added. As such, the Level 3 dataset is the core dataset of BEACH and should be the default for any analysis. It is based on BEACH Level 2 datasets of single sonde profiles. Aggregated QC information can be found in the `sonde_qc` variables and further details are stored in the separate Level_3_QC dataset or respective Level 2 datasets. For analyses using the time, refer to the BEACH Level 2. Circle products, like mesoscale divergence and vertical velocity can be found in BEACH Level 4.
title: BEACH dropsonde dataset (Level 3)