from orcestra.flightplan import sal, bco, LatLon, IntoCircle, path_preview, plot_cwv, plot_usurf
import matplotlib.pyplot as plt
from datetime import datetime
import intake
cat = intake.open_catalog("https://tcodata.mpimet.mpg.de/internal.yaml")
date_time = datetime(2024, 8, 28, 12, 0, 0)
date_time_str = date_time.strftime('%Y-%m-%d')
flight_time = datetime(2024, 8, 30, 18, 0, 0)
airport = sal
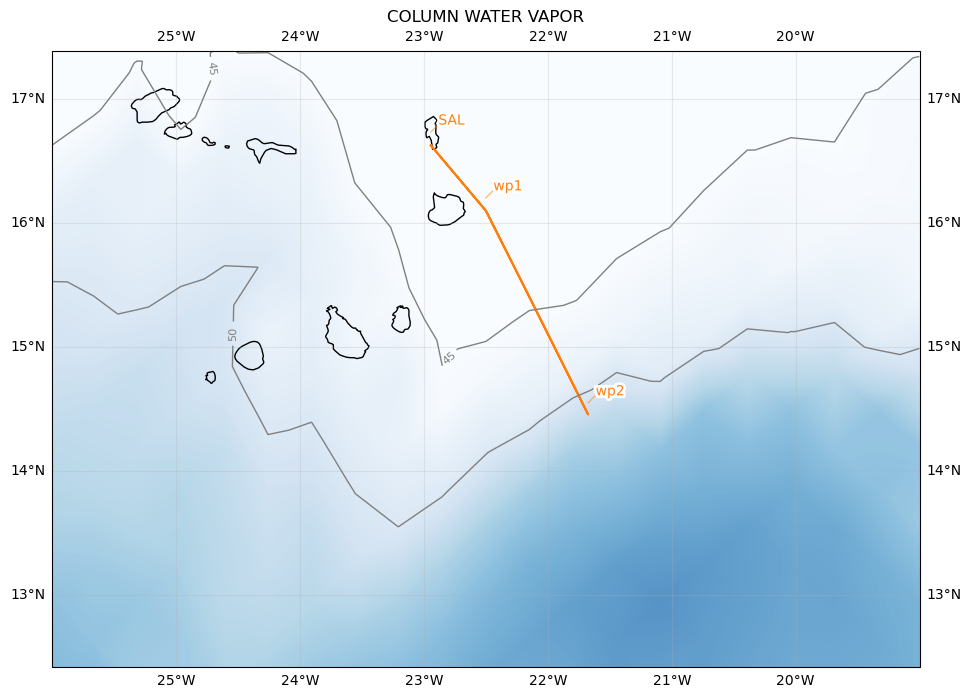
wp1 = LatLon(lat=16.204, lon=-22.5, label='wp1')
wp2 = LatLon(14.550, lon=-21.675, label='wp2')
path = [airport, wp1, wp2, wp1,airport]
ds = cat.HIFS(refdate=date_time_str, reftime=date_time.hour).to_dask()
cwv_flight_time = ds["tcwv"].sel(time=flight_time, method = "nearest")
ax = path_preview(path)
ax.set_extent([-26, -19, 12.5, 17.5])
plot_cwv(cwv_flight_time)
plt.title('COLUMN WATER VAPOR')
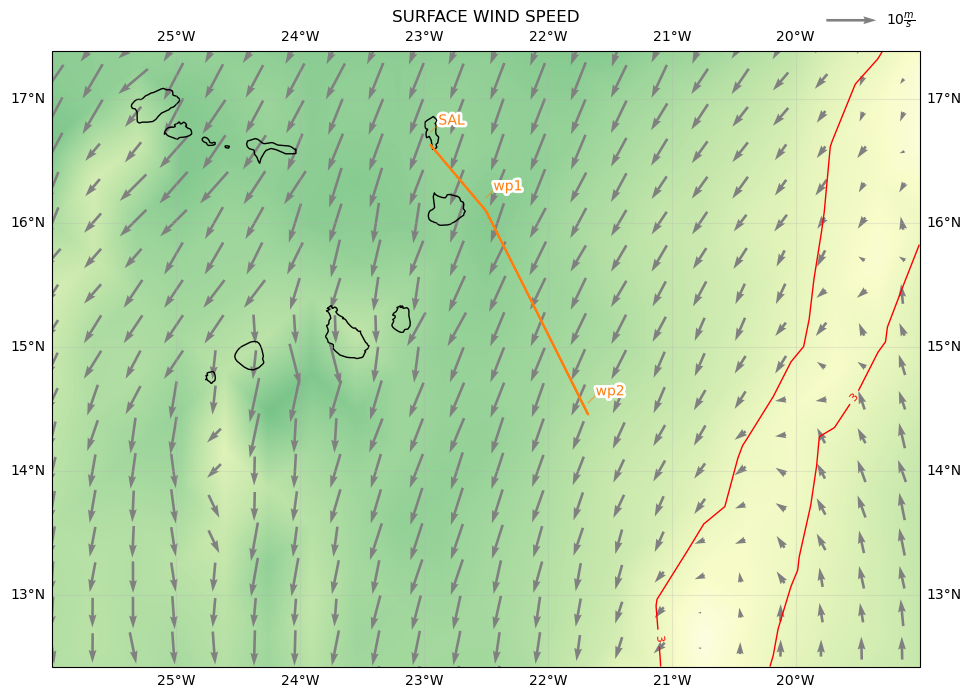
u_latest = ds["10u"].sel(time=flight_time, method = "nearest")
v_latest = ds["10v"].sel(time=flight_time, method = "nearest")
time_of_usurf = ds["time"].sel(time=flight_time, method = "nearest")
usurf_latest = (u_latest ** 2 + v_latest ** 2) ** (1/2)
# Plot the flight path
ax = path_preview(path)
# PLot the surface wind speed
ax.set_extent([-26, -19, 12.5, 17.5])
plot_usurf(usurf_latest,levels=[0, 3])
plt.title('SURFACE WIND SPEED')
import healpix as hp
import numpy as np
import xarray as xr
MESH_GRID_SIZE = 50
QUIVER_SKIP = 2
def wind_direction_plot(ds, u10m, v10m, ax):
# lon_min, lon_max, lat_min, lat_max = ORCESTRA_DOMAIN
lon_min, lon_max, lat_min, lat_max = -26, -18, 12, 19
lon1 = np.linspace(lon_min, lon_max, MESH_GRID_SIZE)
lat1 = np.linspace(lat_min, lat_max, MESH_GRID_SIZE)
pix = xr.DataArray(
hp.ang2pix(
ds.crs.healpix_nside,
*np.meshgrid(lon1, lat1),
nest=True,
lonlat=True,
),
coords=(("lat1", lat1), ("lon1", lon1)),
)
Q0 = ax.quiver(
lon1[::QUIVER_SKIP],
lat1[::QUIVER_SKIP],
u10m.isel(cell=pix)[::QUIVER_SKIP, ::QUIVER_SKIP],
v10m.isel(cell=pix)[::QUIVER_SKIP, ::QUIVER_SKIP],
color="gray",
pivot="middle",
scale_units="inches",
width=0.003,
scale=20,
)
ax.quiverkey(
Q0,
0.95,
1.05,
10,
r"$10 \frac{m}{s}$",
labelpos="E",
coordinates="axes",
animated=True,
)
wind_direction_plot(ds,u_latest,v_latest,ax)